스펙트럼
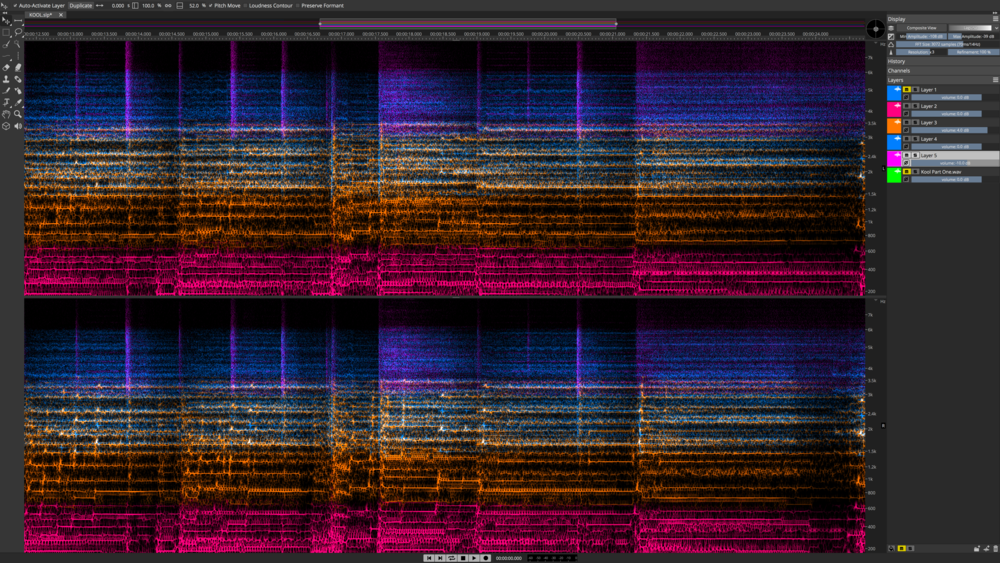
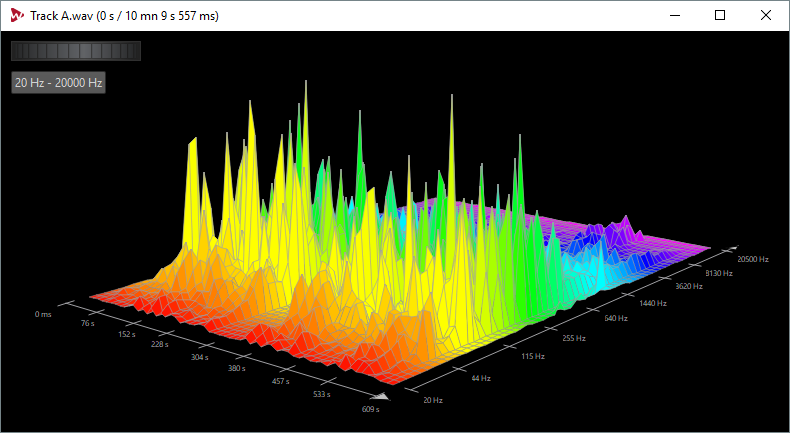
주파수 성분을 주파수 축, 레벨 축, 시간 축 으로 나타낸 그래프.
스팩트럼의 표현 방법에 따라, 주파수 축, 레벨 축을 X, Y 축으로 나타내는 그래프도 있고, 시간 축, 주파수 축을 X, Y 로 나타내는 그래프도 있으며, 3D 그래프로 표현하면 주파수 축, 레벨 축, 시간 축을 X, Y, Z 로 표현 하는 경우도 있다.
Spectrum
A graph that represents the frequency components along the frequency axis, the level axis, and the time axis.
Depending on the representation method of the spectrum, there are graphs that show the frequency axis and the level axis as the X and Y axes, graphs that show the time axis and the frequency axis as the X and Y axes, and in some cases, a 3D graph that represents the frequency axis, level axis, and time axis as the X, Y, and Z axes.
Frequency Domain Spectrum
Time Domain Spectrum
- X 축: 시간
- Y 축: 주파수


